Top 10 Source Countries [Bytes or Flows]
The Top 10 Source Countries table lists the top 10 countries generating the largest number of bytes or flows. Click on the + sign to the left of the source country to show the devices associated with the source country.
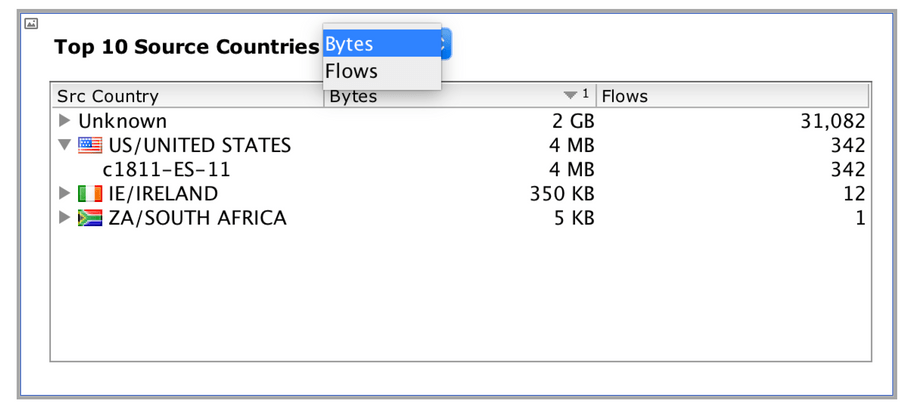
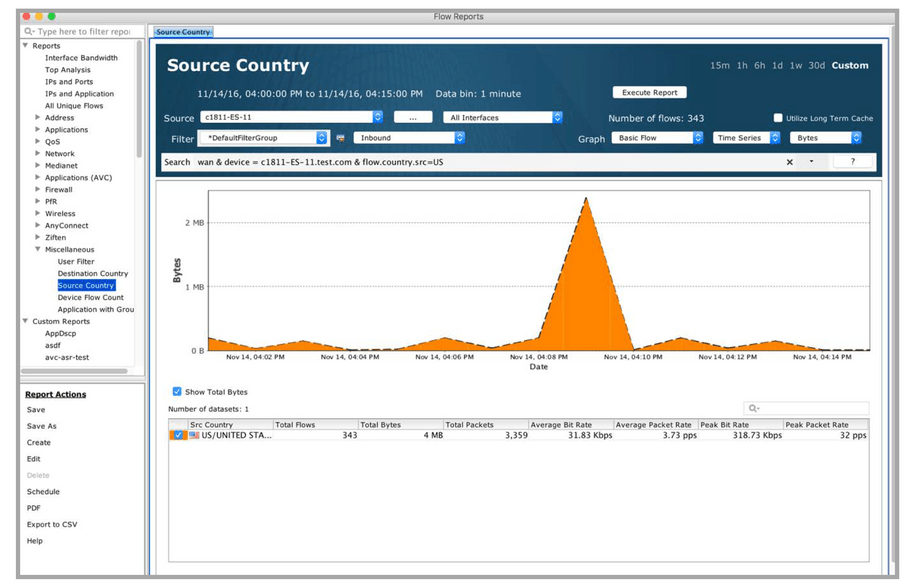
Click on the Top 10 Source Country header to generate a Source Country inbound flow report for all devices and all interfaces sorted in order by Bytes or Flows as selected from the previous table.
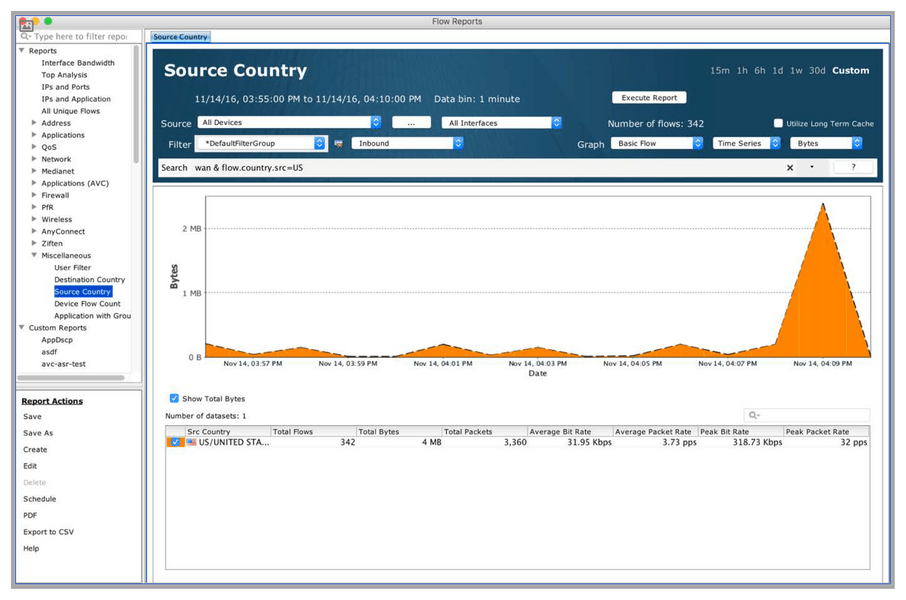
Right-click on a source country to display a Source Country inbound flow report specific to the selected country.
Expand a source country to show devices and right click on a device to select between Graph View and Top Analysis View.
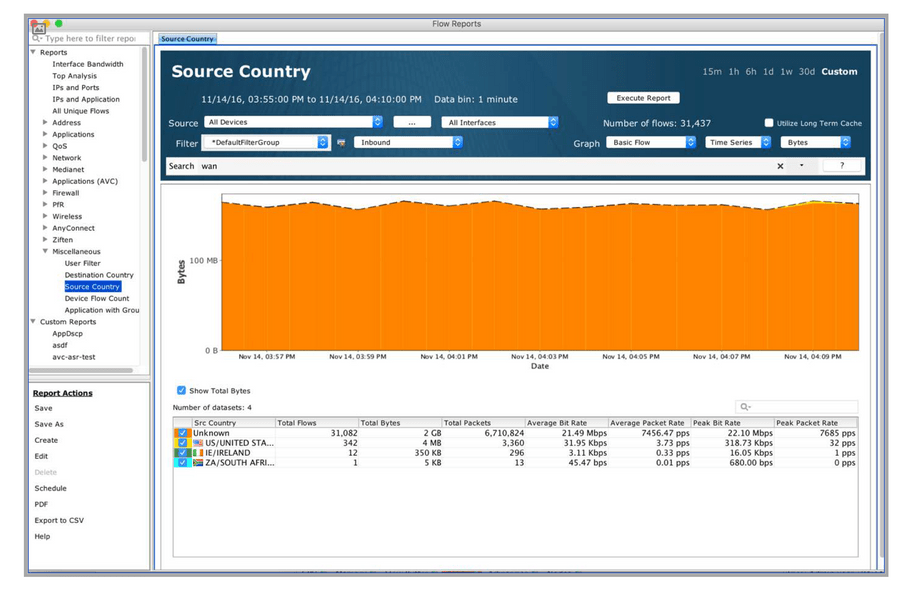
Graph View – generates a Source Country inbound flow report for the selected source country for all devices. A Tag Filters alert dialog window may appear to ask if you would like to query for All Devices.
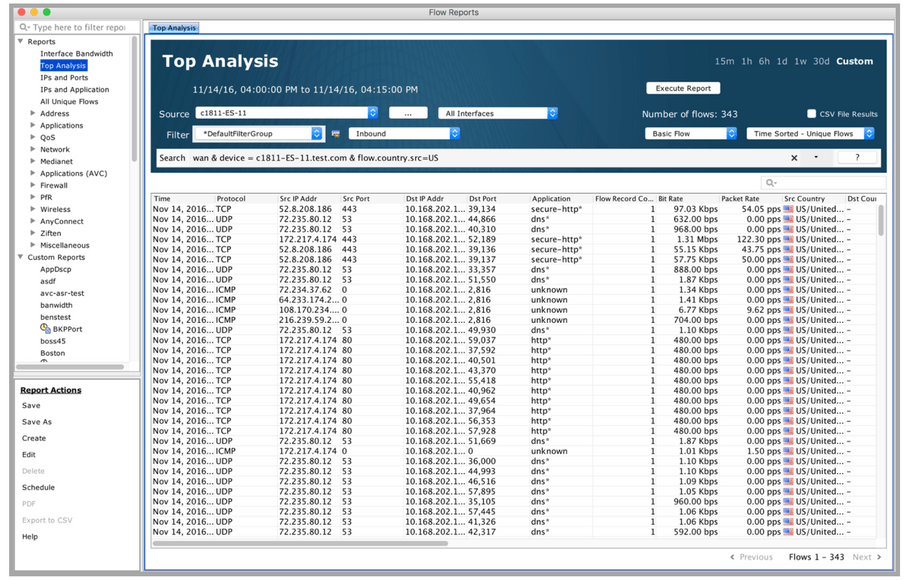
Top Analysis View – generates a Top Analysis inbound flow report for the selected device.